In my online undergraduate P5.js course, students are about to begin the module on motion and physics, including a bit of physics simulation using Matter.js. It suddenly occurred to me that I had never seen anybody put together this particular demo before, and I realized it had to be done. Messy source code here.
Das wegen eines fehlendes IT-Sicherheitskonzeptes jahrelang ruhende Klageverfahren gegen die zentrale Gesundheitsdatensammlung im Forschungsdatenzentrum wird nun weitergehen. Die Gesundheitsdaten von 73 Millionen gesetzlich Versicherten werden dort zentral gespeichert und für Forschungszwecke zugänglich gemacht. Wir fordern ein Widerspruchsrecht.
As applications grow in complexity, maintaining a clean architecture becomes increasingly challenging. The traditional package-by-layer approach of organizing code into controllers, services, repositories, and entities packages often leads to tightly coupled code that’s hard to maintain and evolve.
Spring Modulith, combined with IntelliJ IDEA’s excellent tooling support, offers a powerful solution for building well-structured modular monoliths.
In this article, we will use a bookstore sample application as an example to demonstrate Spring Modulith features.
This package-by-layer style causes several problems.
The Code Structure Doesn’t Express What the Application Does
When you open the project, you see “repositories,” “services,” and “web,” but not “catalog,” “orders,” or “inventory.” The domain is hidden behind technical folders, which makes it harder for developers to find feature-related code and understand boundaries.
Everything Tends to Become Public
In a layer-based layout, types in one package are often used from many others. To allow that, classes are made public, which effectively exposes them to the whole application. There is no clear “public API” per feature, and hence anything can depend on anything.
Tight Coupling and Spaghetti Code
With no explicit boundaries, services and controllers from different features depend on each other’s internals. For example, order logic might call catalog’s ProductService directly or reuse internal DTOs. Over time this turns into a tightly coupled “big ball of mud” where changing one feature risks breaking others.
Fragile Changes
Adding or changing a feature often forces you to touch code in repositories, services, and web at once, with no clear “module” to test or reason about. Refactoring becomes risky because the impact is hard to see.
In short: package-by-layer encourages a single, undivided monolith with weak boundaries and unclear ownership. Spring Modulith addresses this by turning your codebase into an explicit set of modules with clear APIs and enforced boundaries.
2. What Benefits Spring Modulith Brings
Spring Modulith helps you build modular monoliths: one deployable application, but with clear, domain-driven modules and enforced structure.
Explicit Module Boundaries
Modules are direct sub-packages of your application’s base package (e.g. com.example.bookstore.catalog, com.example.bookstore.orders). Spring Modulith treats each as a module and checks that:
Other modules do not depend on internal types unless they are explicitly exposed.
There are no circular dependencies between modules.
Dependencies between modules are declared (e.g. via allowedDependencies), so the architecture stays intentional.
Clear Public APIs
Each module can define a provided interface (public API): a small set of types and beans that other modules are allowed to use. Everything else is internal. This reduces coupling and makes it obvious how modules interact.
Event-Driven Communication
Spring Modulith encourages events for cross-module communication (e.g. OrderCreatedEvent). It provides:
@ApplicationModuleListener for module-aware event handling.
Event publication registry (e.g. JDBC) so events can be persisted and processed reliably.
Externalized events (e.g. AMQP, Kafka) to integrate with message brokers and other applications.
This keeps modules loosely coupled and makes it easier to later extract a module into a separate service.
Testability
You can test one module at a time with @ApplicationModuleTest, controlling which modules and beans are loaded. You mock other modules’ APIs instead of pulling in the whole application, which speeds up tests and keeps them focused.
Documentation and Verification
Spring Modulith can:
Verify modular structure in tests via ApplicationModules.of(...).verify().
Generate C4-style documentation from the same model.
So the documented architecture and the actual code stay in sync.
Gradual Migration Path
You can introduce Spring Modulith into an existing Spring Boot monolith step by step: first refactor to package-by-module, then add the Spring Modulith dependencies and ModularityTest, and fix violations one by one. You don’t need to rewrite the application.
3. How to Add Spring Modulith to a Spring Boot Project
Add the Dependencies
Use the Spring Modulith BOM and add the core and test starters:
Spring Modulith support is bundled in IntelliJ IDEA with the Ultimate Subscription and is enabled by default once the Spring Modulith dependencies are on the classpath.
To confirm the plugin is enabled:
Open Settings (Ctrl+Alt+S / Cmd+,).
Go to Plugins → Installed.
Search for Spring Modulith and ensure it is checked.
You can then use module indicators in the project tree, the Structure tool window, and Modulith-specific inspections and quick-fixes.
Add a Modularity Test
Add a test that verifies your modular structure so that violations are caught in CI:
After refactoring to package-by-module, this test will fail until all boundary and dependency rules are satisfied. Fixing those failures is the main migration work.
4. Converting a Monolith into a Modulith: Refactoring to Package-by-Module
Let’s see how we can convert a monolith application into a modular monolith one step at a time.
Step 1: Reorganize to Package-by-Module
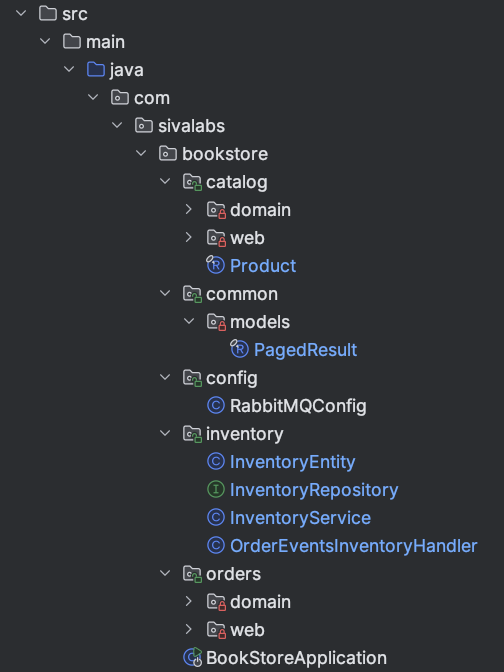
Move from layer-based packages to module-based (package-by-module) packages. Each top-level package becomes a module.
Create the new package structure (e.g. catalog, orders, inventory, common with subpackages like domain, web, etc).
Move classes from entities, repositories, services, web into the appropriate feature package. Prefer package-private (no modifier) for types that should stay internal.
Replace a single GlobalExceptionHandler with module-specific exception handlers (e.g. CatalogExceptionHandler, OrdersExceptionHandler) in each module’s web (or equivalent) package.
Move and adjust tests to match the new structure.
After this, the code is organized by feature, but Spring Modulith is not yet enforcing boundaries. Adding the dependency and running ModularityTest will surface the next set of issues.
Step 2: Fix Module Boundary Violations
When you run ModularityTest, you’ll see errors such as:
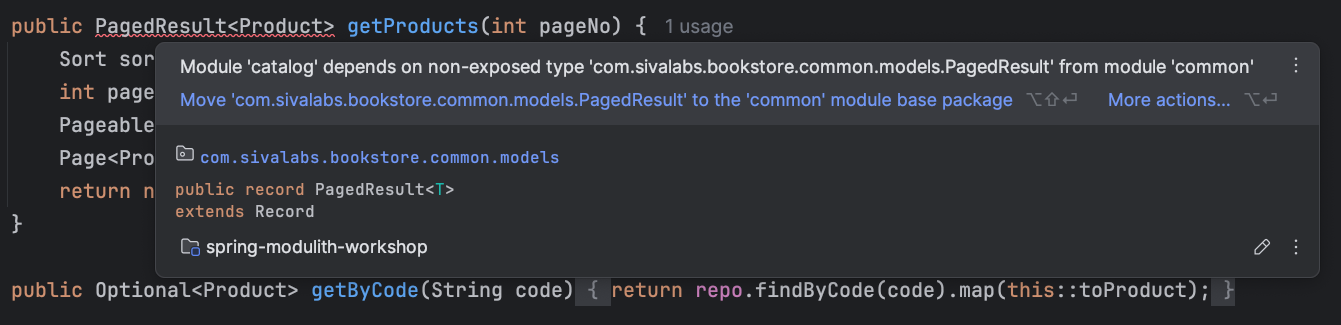
Module ‘catalog’ depends on non-exposed type … PagedResult within module ‘common’!
Module ‘inventory’ depends on non-exposed type … OrderCreatedEvent within module ‘orders’!
Module ‘orders’ depends on non-exposed type … ProductService within module ‘catalog’!
Fixing these errors is where module types, named interfaces, and public APIs come in.
Add the following dependency to use Spring Modulith features to specify module types, named interfaces, etc:
Then other modules can depend on orders::order-models (or the whole module) in their allowedDependencies.
Introduce a Public API (Provided Interface)
When another module needs to call your module’s logic, don’t expose the internal service. Expose a facade or API class in the module’s root package (or a dedicated API package):
package com.sivalabs.bookstore.catalog;

@Service
public class CatalogApi {
    private final ProductService productService;

    public CatalogApi(ProductService productService) {
        this.productService = productService;
    }

    public Optional<Product> getByCode(String code) {
        return productService.getByCode(code);
    }
}
Then in the orders module, depend on CatalogApi instead of ProductService. Spring Modulith will treat CatalogApi as the provided interface and ProductService as internal.
Step 3: Declare Explicit Module Dependencies (Optional but Recommended)
By default, a module may depend on any other module that doesn’t create a cycle. To make dependencies explicit, list allowed targets in package-info.java:
If the orders module later uses something from a module not in this list (e.g. inventory), modules.verify() will fail and IntelliJ will show a violation. This keeps the dependency graph intentional and documented.
Step 4: Prefer Event-Driven Communication
For cross-module side effects (e.g. “when an order is created, update inventory”), prefer events instead of direct calls:
Publishing module (e.g. orders): publishes OrderCreatedEvent via ApplicationEventPublisher.
Consuming module (e.g. inventory): handles it with @ApplicationModuleListener (and optionally event persistence or externalization).
This avoids the consuming module depending on the publisher’s internals and keeps the path open for later extraction to a separate service or messaging.
When the application publishes events, first they will be stored in a database table, and after successful processing they will be deleted or marked as processed.
5. How does IntelliJ IDEA Help with Inspections and Quick Fixes?
Spring Modulith violations don’t cause compilation or runtime errors by themselves, they fail Modulith-specific tests (e.g. ModularityTest). IntelliJ IDEA’s Spring Modulith support turns these into editor-time feedback with inspections and quick-fixes so you can fix structure issues as you code.
Inspections and Severity
IntelliJ runs a set of inspections that check your code against Spring Modulith’s rules. By default, they are configured as errors (red underlines), even though the project still compiles. This helps you treat modularity as a first-class constraint.
You can adjust severity in Settings → Editor → Inspections under the Spring Modulith group if you want to start with warnings.
Violations Shown in the Editor
As soon as you introduce a dependency that breaks module boundaries, IntelliJ highlights it. For example:
A class in catalog module using PagedResult from common without common being OPEN or exposing that type.
A class in orders using catalog’s internal ProductService instead of the public CatalogApi.
A class in inventory using orders’ internal OrderCreatedEvent type before it is exposed via a named interface.
You don’t have to run the full test suite to see these issues, they appear as you write or refactor code.
Quick-Fixes (Alt+Enter)
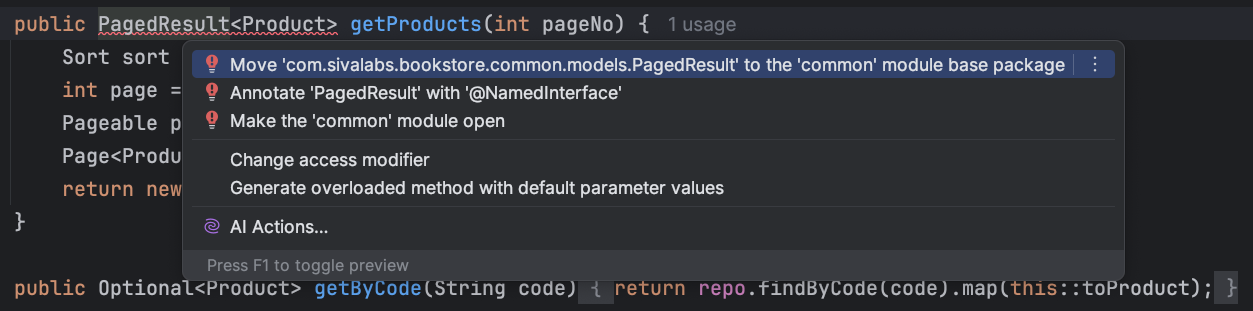
When the cursor is on a Modulith violation, Alt+Enter (or the lightbulb) opens quick-fixes that align the code with the modular structure. Typical options:
Annotate the type with @NamedInterface: Expose the class (or its package) as a named interface so other modules can use it.
Open the module that contains the type: IntelliJ creates or updates package-info.java in that module and marks it as @ApplicationModule(type = ApplicationModule.Type.OPEN), exposing all its types.
Move the component to the base package: Move the bean to the application’s root package so it’s outside any module (use sparingly).
Choosing the right fix depends on your design: use OPEN for shared utility modules, NamedInterface for a few shared types (e.g. events), and public API classes for behavioral dependencies.
Bean Injection and Module Boundaries
IntelliJ’s Spring bean autocompletion is aware of module boundaries. If you try to inject a bean that belongs to another module and is not part of that module’s public API, the completion list can show a warning icon next to that bean. This helps you avoid introducing boundary violations when wiring dependencies.
Undeclared Module Dependencies
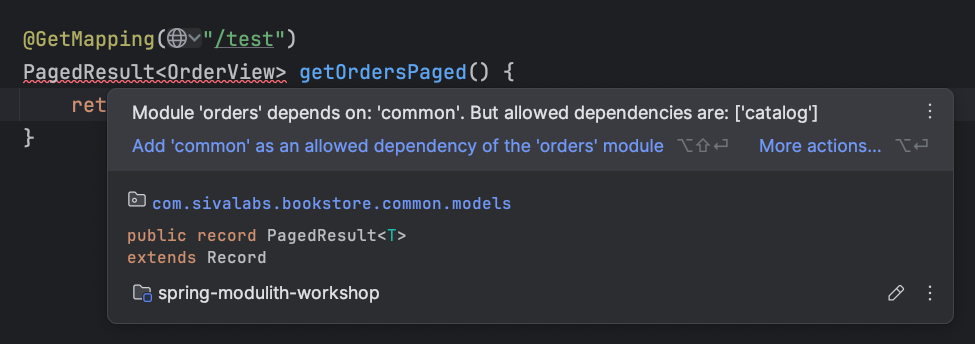
When a module has explicit allowedDependencies (e.g. orders only allow catalog and common) but you use a type from another module (e.g. inventory), IntelliJ reports a violation: the dependency is not declared.
Quick-fix: Add the missing module (or the required named interface) to allowedDependencies in the module’s package-info.java. IntelliJ can suggest adding the dependency.
Working with allowedDependencies
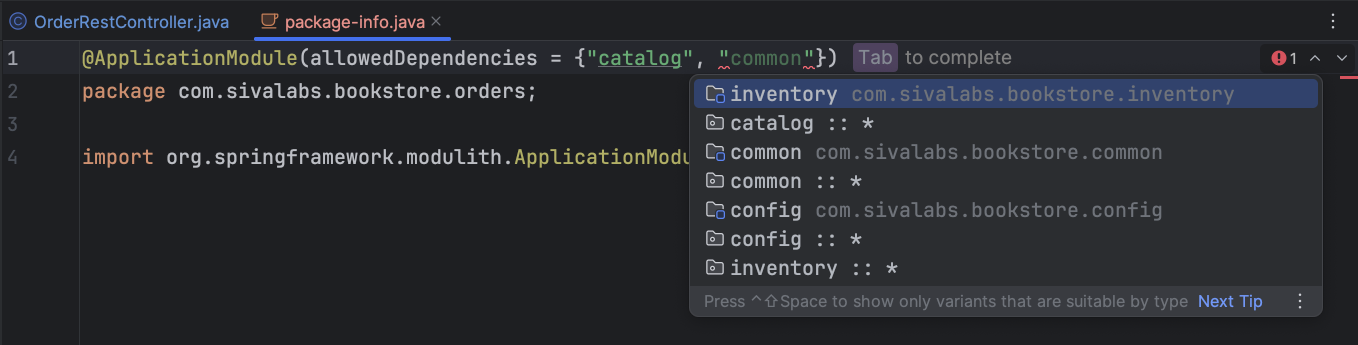
In package-info.java, when you edit allowedDependencies = {"..."}, IntelliJ provides:
Completion (Ctrl+Space) with:
module — dependency on the whole module.
module::interface — dependency on a specific named interface.
module::* — dependency on all named interfaces of that module.
Validation: if a listed module or interface doesn’t exist, IntelliJ highlights the reference so you can fix it before running tests or starting the app.
Navigation: Ctrl+B on a module name in allowedDependencies jumps to that module in the Project view.
Circular Dependencies
Spring Modulith’s verification detects cycles between modules, e.g.:
To fix this, you need to break the cycle in code: remove the dependency (e.g. catalog → orders) by using events, moving shared types to common, or redefining which module owns which responsibility.
Visualizing Modules in IntelliJ IDEA
Project tool window (Alt+1): Top-level modules are marked with a green lock; internal (non-exposed) components can be marked with a red lock. This gives a quick visual of boundaries.
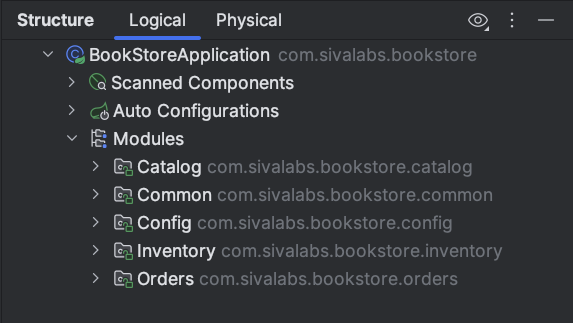
Structure tool window (Alt+7): With the main @SpringBootApplication class selected, open Structure and use the Modules node to see the list of application modules, their IDs, allowed dependencies, and named interfaces.
Using both views helps you understand and fix dependency and boundary issues quickly.
6. Verifying and Evolving Your Modular Structure
Keep Running ModularityTest
After each refactoring step, run ModularityTest. It should pass, once we have completed the following:
All cross-module references go to exposed types (OPEN modules, named interfaces, or public API classes).
There are no circular dependencies.
Any explicit allowedDependencies include all modules (and interfaces) that are actually used.
6.2 Generate Documentation
You can extend the test to generate C4-style documentation so the architecture is visible and up to date:
@Test
void verifiesModularStructure() {
    modules.verify();
    new Documenter(modules).writeDocumentation();
}
Output is written under target/spring-modulith-docs.
Test Modules in Isolation
Use @ApplicationModuleTest to load only one module (and optionally its dependencies) and mock other modules dependencies:
Bootstrap modes control how much of the application is loaded, making tests faster and more focused.
STANDALONE (default): Load only the module being tested
DIRECT_DEPENDENCIES: Load the module and its direct dependencies
ALL_DEPENDENCIES: Load all transitive dependencies
7. Conclusion
Building a modular monolith with Spring Modulith improves long-term maintainability and prepares the codebase for possible extraction of modules into separate services. The main ideas:
Avoid package-by-layer: Organize by feature/module (package-by-feature) so that the structure reflects the domain.
Define clear boundaries: Use OPEN for shared utility modules, named interfaces for shared types (e.g. events), and public API classes for cross-module behavior.
Declare dependencies: Use allowedDependencies so the intended dependency graph is explicit and violations are caught early.
Prefer events for cross-module side effects to keep coupling low.
Verify continuously with ModularityTest and optional documentation generation.
IntelliJ IDEA’s Spring Modulith support turns modularity into a day-to-day concern: module indicators, Modulith inspections, quick-fixes, and dependency completion help you respect boundaries and fix common issues without leaving the editor. For more detail, see IntelliJ IDEA’s Spring Modulith documentation.
Start by refactoring one area to package-by-feature, add Spring Modulith and a modularity test, then fix violations step by step using IntelliJ IDEA’s feedback to guide the way.
Die Bundesregierung plant eine riesige anlasslose Datenhalde, die zur Nutzerprofilierung gradezu einlädt: die Vorratsdatenspeicherung von IP-Adressen nebst Begleitdaten. Eine derart weitgreifende Überwachungsmaßnahme ist und bleibt unverhältnismäßig und gefährlich. Und die Ideen aus Brüssel sind noch schlimmer.
Gather ingredients, make dishes and feed all the strange creatures in a deck-builder that manages to set itself apart from the others in Hungry Horrors.
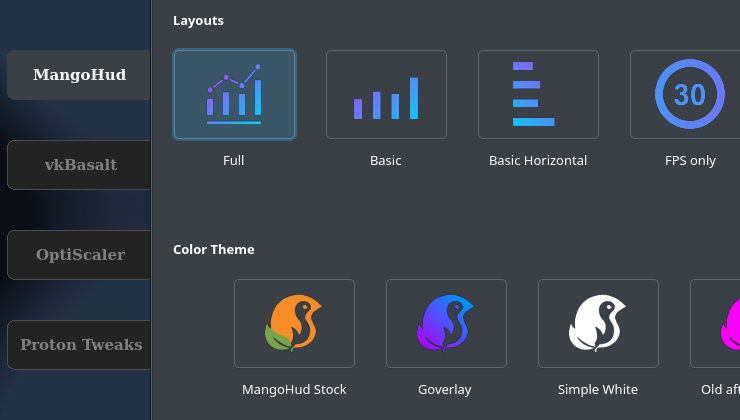
Goverlay is a useful tool for configuring the likes of MangoHud, vkBasalt, and OptiScaler. Recently it arrived on Flathub, and a major new update is out.


 .
.